Codebase here: https://github.com/jed-gore/stock_betas
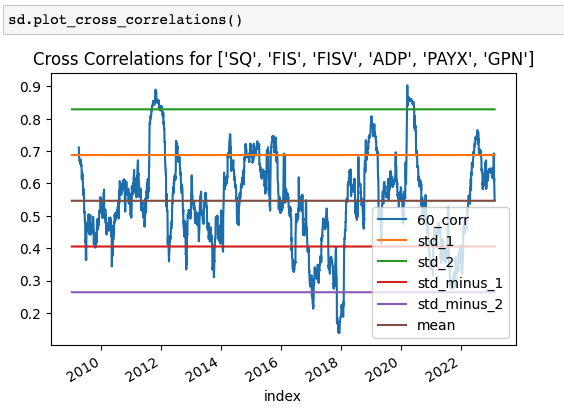
Monitoring cross-correlations inside a sector, to see if there’s enough differentiation for pair trading.
As a former PM, I would avoid pair trading a group when correlations were high.
This group of processors is sitting right on the mean.
The chart shows a 60 day rolling window, the function takes days as a parameter.