Sometimes you want to store your model output in a dataframe, for example when running grouped regressions so you’ll have multiple regression outputs to review and sort etc.
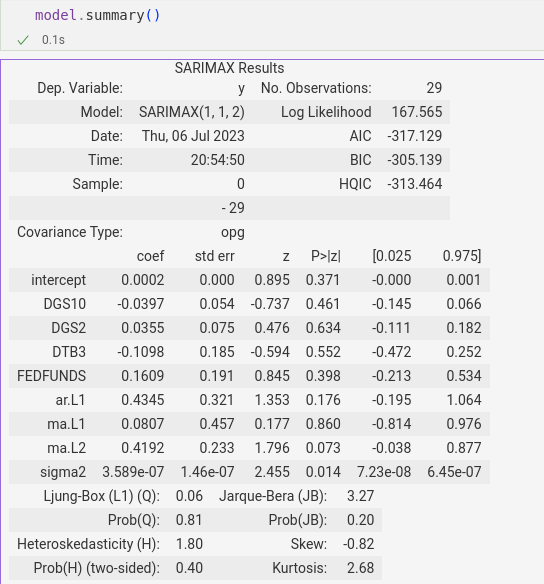
But while using pmdarima’s auto_arima() function I was surprised to learn there’s no summary2() as you’ll find in statsmodels. Instead you’ll get that same retro block of text which has been familiar to users of Python scikit-learn and R’s glm() for two decades:
To be sure, you can extract some of this data with the .tables property list. For example, .tables[1] returns
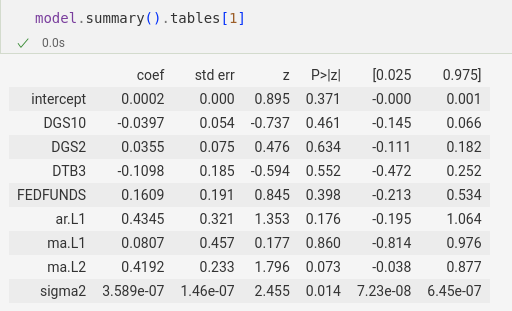
which looks great! and you can send this into a pd.DataFrame() and get a dataframe
(albeit one with non-string column names so you can’t reference the columns in slicing).
but…
those individual cell values in the table are of type statsmodels.iolib.table.Cell
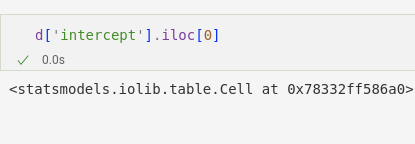
which cannot be coerced to anything nor assigned to a new dataframe in a series nor really used for anything at all.
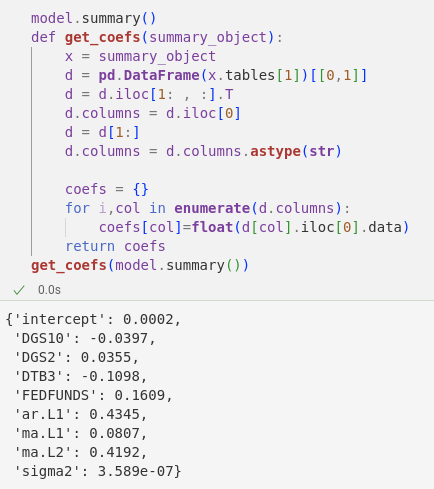
Fortunately the “Cell” object has a .data property which can be used to extract the individual items.
TLDR: to save you the same headache, here’s a function to extract cell values from Summary() objects in pmdarima auto_arima:
Have a nice day.